
A1. The Basics of Technical Analysis
This beginner’s guide will teach you the fundamentals of technical analysis, and how to use it to trade Forex.

A2. Top 3 Technical Analysis Charts for Trading
Understanding the fundamentals of chart analysis is critical for beginners.

A3. The Trend is Your Friend: Forex Trendlines
Forex traders need to know what trendlines are, how to draw them, and how to use them in their forex trading.

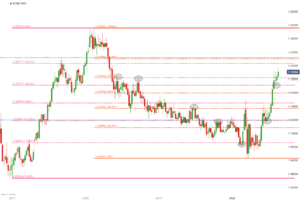
A4. Support and Resistance Levels
One of the most commonly tracked technical indicators in the FX market is support and resistance.

B1. Technical Indicators Defined and Explained
An explanation of technical indicators, from RSI to Ichimoku, and how to respond to them.

B2. Using Price Action As Your First Indicator in Technical Analysis
Learn how to base financial decisions on price action signals.

B3. Every Trader Should Know These 4 Effective Trading Indicators
Forex indicators are the best when used in combination to form a simple strategy: MACD, Stochastic, and RSI are excellent forex indicators.

B4. Moving Average (MA) Explained for Traders
Moving Average is a popular trend indicator. In this article, we’ll teach you how to interpret and use it.

B5. The Stochastic Oscillator Explained
The stochastic oscillator can be used to measure momentum and trend strength.

B6. The Significance of Overbought and Oversold Conditions for Traders
Identify the conditions under which an FX pair is overbought or oversold and what opportunities present themselves.

B7. Which Indicators Should You Trade With? – The Leading Versus The Lagging
There are both positive and negative aspects to each one of these indicators. Which one is right for you?

B8. What are lagging indicators and how are they defined?
Lagging indicators are great for analysing the financial markets, but they are often misunderstood.

B9. Leading Indicators Defined and Explained
Using leading indicators, traders can foretell currency prices and identify stops and limits.

C1. What is the Best Time Frame to Trade Forex?
Which time period is best for trading forex? Learn how to determine a timeframe that corresponds to your objectives.

C2. How to Use Multiple Time Frames to Improve Your Trading Performance
Spotting ideal entries into the market while spotting general trend at the same time is possible with the aid of multiple time frame analysis.

C3. Forex Trading Time Frames: A Beginner’s Guide
You may be able to see bigger trends and more granular price action if you use different time periods.

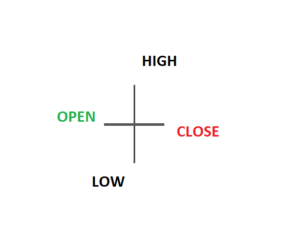
D1.1. How to Read a Candlestick Chart
Get expert advice on how to read and interpret candlestick charts for day trading, including the best strategies and pointers.

D1.2. Top 10 Candlestick Patterns To Trade the Markets
Identify the 10 candlestick patterns that are the most reliable for trading the financial markets.

D1.3. Trading With The Hammer Candle
Learn how to spot a bullish reversal in the markets using the hammer candlestick pattern.

D1.4. How to Trade Shooting Star Candlestick Patterns
Discover how to trade the Shooting Star, a frequently utilized reversal pattern among FX traders.

D1.5. Trading the Inverted Hammer Candle
The inverted hammer candle is useful for identifying bullish market reversals.

D1.6. How to Trade Reversals with the Hanging Man Pattern
How to interpret the Hanging Man candle, and what it means.
D1.7. Trading the Doji Candlestick Pattern
The Doji candle, also known as the Doji star, symbolizes indecision in the foreign exchange market.
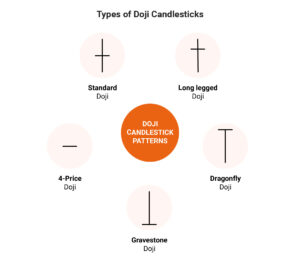
D1.8. Top 5 Types of Doji Candlesticks
Learn about the formation of Doji patterns and identification of the top 5 frequently traded types.

D1.9. Trading with Spinning Top Candlestick Patterns
The Spinning Top Candlestick Indicates Market Indecision.

D2.1. Engulfing Candle Patterns & How to Trade Them
Discover the art of reading and analyzing candlestick charts for day trading and gain insights on the top strategies and tips for success.

D2.2. Trading the Bullish Engulfing Candle
The bullish engulfing pattern is a simple and recognizable price action tool that can be used in any trading approach.

D2.3. Trading with the Bearish Engulfing Candle
Discover the Benefits of Trading with the Bearish Engulfing Pattern for Reversal Signals.

D2.4. Unlocking the Secrets of Harami Candlestick Patterns for Traders
The Harami candlestick pattern is a tool used by forex traders to identify potential trend reversals or continuations.

D2.5. Trading Reversals with the Harami Candlestick
Discover the art of utilizing Harami candlesticks to determine market sentiment and pinpoint potential risks and biases.

D2.6. Trading the Bullish Harami Pattern
The Bullish Harami is a well-known forex pattern for both trend reversal and continuation.

D2.7. Trading The Bearish Harami
The Bearish Harami is a candlestick pattern that signals a potential reversal of an uptrend.

D2.8. Trading The Piercing Line Pattern
Discover the art of trading the Piercing Line, a pattern that signals a bullish reversal at the bottom of a downward trend.

D2.9. Trading The Dark Cloud Cover Candlestick
The Dark Cloud Cover pattern is a useful tool for identifying potential trend reversals and for achieving favorable risk-reward ratios in trades.

D3.1. The Morning Star Candlestick: A Guide For Forex Traders
The Morning Star candlestick pattern signals a potential market bottom and reversal in FX trading.

D3.2. Trading The Evening Star Candlestick Pattern
The Evening Star candlestick pattern is a commonly used tool in forex trading that indicates a market top and the possibility of a reversal.

D3.3. Trading Long Wick Candles
Trading with attention to candle wicks is frequently ignored, but it can enhance a trader’s strategies.

D3.4. Trading The Inside Bar Pattern
The inside bar strategy can improve market analysis techniques when integrated into a trading system.

E1. The Forces of Supply and Demand
Every price movement is driven by supply and demand, which play a crucial role in every trade and chart.

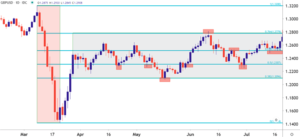
E2. Trading Supply and Demand
Price is determined by the forces of supply and demand. Discover how to recognize supply and demand zones in forex trading.

E3. Supply and Demand vs. Support and Resistance
Supply and demand and support and resistance are comparable in trading, yet they have distinct fundamental differences.

E4. Psychological Levels & Round Numbers in Forex Trading
Forex traders often pay attention to key levels in the market. Discover the psychological aspect and how to trade it by exploring further.

F1. Trading the Gap: What are Gaps & How to Trade Them
Unclear about chart gaps? Let us explain the reasons for their occurrence, the different types, and how to effectively trade them.

F2. Trading the Double Top Pattern
Discover how to identify Double Tops in forex charts and how to utilize them for effective trade planning.

F3. Trading the Double Bottom Pattern
Few patterns are as effective in signaling a change in market direction as the Double Bottom pattern.

F4. Trading the Head and Shoulders Pattern
The Head and Shoulders pattern is recognized as one of the most reliable reversal patterns in the trading world and is used by traders of all levels, from novice to experienced.

F5. Using the Rising Wedge Pattern in Forex Trading
The Rising Wedge is a commonly used reversal pattern that provides traders with information about the future direction and magnitude of price movements.
F6. Trading The Falling Wedge Pattern
The Descending Wedge, commonly referred to as the Falling Wedge, is an indicator of future bullish momentum in the market.

F7. Trading the Cup and Handle Pattern
The cup and handle pattern is a common occurrence in financial markets, and incorporating it into a trading system can improve a trader’s market analysis skills.

F8. Identifying and Trading Bullish and Bearish Pennant Patterns
The Pennant pattern is similar to Triangle patterns, in that it is a continuation pattern that helps traders predict future market movements.

F9. Using Rectangle Patterns to Trade Breakouts
Discover the Art of Trading the Rectangle Pattern: A Guide to Trading Breakouts.

F10. 3 Triangle Patterns Every Forex Trader Should Know
Triangle patterns come in three main variations, which predict future price movements and the potential continuation of a trend.

F11. Trading the Ascending Triangle: Understanding and Strategy
The Ascending Triangle, sometimes referred to as the ‘rising triangle’, is a popular continuation pattern that occurs during a trend.

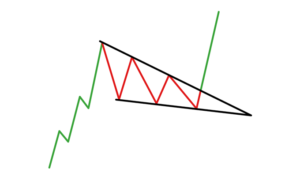
F12. Discovering the Descending Triangle: Understanding and Trading the Pattern
Discover the essential information on recognizing and trading the Descending Triangle, a must-know continuation pattern for all forex traders.

F13. Trading the Bullish Flag Pattern
Flag patterns are valuable for recognizing market entry points. Learn to trade the Bullish formation.

F14. Trading the Bearish Flag Pattern
Discover the technique for trading the dynamic movements linked to the bear flag pattern.
G1. Understand the Relative Strength Index (RSI)
A Valuable Oscillator for Timing Entries and Exits. Discover the benefits of this indicator.

G2. How to Use the RSI Indicator for Trading
The Relative Strength Index (RSI) is a widely used technical indicator for determining overbought or oversold conditions in the market. Discover how to trade with the RSI.

H1. Getting Started with Moving Averages
The moving average is a straightforward yet practical signal that can serve various purposes.

H2. Definition and Explanation of Exponential Moving Average (EMA)
Discover the exponential moving average, which is a modified version of the traditional moving average and an excellent technical signal.

H3. Simple Moving Average (SMA) vs Exponential Moving Average (EMA)
Presented here is a succinct summary of the simple and exponential moving averages and how they can be utilized in trading strategies.
H4. Widely Used Moving Averages and Their Applications
Moving averages are a favored technical tool due to their user-friendly characteristics and versatility. Explore more about moving averages.

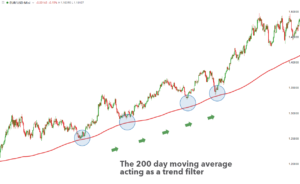
H5. 200 Day Moving Average: What it is and How it Works
Traders frequently use the 200-day moving average to identify long-term trends.

H6. Moving Average Crossover
Overview of Moving Average Crossovers and Their Trading Techniques.

H7. The Golden Cross
A “golden cross” indicates a rise in bullish momentum and could potentially mark the start of a new bullish trend.

H8. The Death Cross
The term “death cross” is used to refer to a technical pattern in trading that is often associated with a potentially bearish trend reversal.

H9. An EMA Strategy with Forex Trends
An EMA strategy is an effective trading approach for forex traders of all levels, providing a complete strategy tailored for trending markets.

H10. Trend Trading with Moving Averages
Moving averages can be used to identify strong trends across financial markets.

I1. The use of Fibonacci in financial markets
Acquire the basics of Fibonacci, its presence in natural phenomena, and its potential in aiding trading and analysis.

I2. The Use of Fibonacci in the Forex Market
Discover how Fibonacci can be employed on a forex pair to assist traders in identifying support or resistance levels that might not have been readily apparent.
I3. Using Fibonacci Retracements in Multiple Time Frame Analysis
By applying Fibonacci retracements across various time frames, traders can pinpoint both short-term and long-term support and resistance levels.

I4. Fibonacci Projections
Fibonacci Extensions can offer a glimpse into potential future price levels when a trend is continuing.

I5. Fibonacci Retracements for Trend Trading
Discover how traders use Fibonacci retracements to time trends and play pullbacks for trend continuation.

I6. Trading Ranges with Fibonacci Retracements
Fibonacci analysis can be useful in determining levels of support and resistance, especially in markets that are trading in a range.
I7. Trading Breakouts with Fibonacci Retracements
One can utilize Fibonacci retracements to identify potential breakouts, especially when a trend enters a range-bound state, and traders wait for the next major move.

I8. Fibonacci Trading, Analysis on Long-Term Charts
Discover the value of long-term charts in short-term strategies and how to use Fibonacci analysis on them for trading.

I9. Fibonacci Scalping on Short-Term Charts
Applying Fibonacci retracements on short-term charts can aid scalpers in identifying trading levels and strategies.