
Trading is filled with jargon that is hard for newbies to comprehend. This article will explain what overbought and oversold currencies mean, and what trading opportunities they create.
OVERBOUGHT VS OVERSOLD
The chart below shows the price movement from the “lower-left to upper-right” and defines the term overbought. A pullback after a significant and consistent upward move in price is a sign of a healthy market. On the other hand, a significant and consistent downward move without a pullback after a period of time is a sign of a bearish market.
USD/CAD HOURLY CHART – OVERBOUGHT:

The phrase oversold describes a decline in price over a specific period of time without much of a recovery. In short, a decline from the “upper-left to the lower-right” on the chart below.
AUD/JPY WEEKLY CHART – OVERSOLD:

Price cannot maintain one direction forever, so price eventually turns around. In addition to being overbought or oversold, currency pairs with signs of reversal sometimes stay overbought or oversold for a long time. Therefore, traders can use an oscillator to identify when a reversal is likely.
OVERBOUGHT OVERSOLD INDICATOR READINGS WITH RSI
Using the Relative Strength Index (RSI), traders can quickly gauge overbought and oversold levels. 70 is overbought when the RSI moves above it, and 30 is oversold when the RSI moves below it.
RSI OVERBOUGHT AND OVERSOLD LEVELS:

When using the RSI, traders need to be patient before entering trades as the RSI can stay overbought or oversold for a prolonged period as seen on the chart below. A common error made by traders is attempting to pick a top or bottom of a strong move that continues to move further into overbought or oversold territory. When the RSI crosses back under the 70 or over the 30 as an instrument to enter, it is time to enter.
RSI PROLONGED OVERBOUGHT AND OVERSOLD SIGNALS:
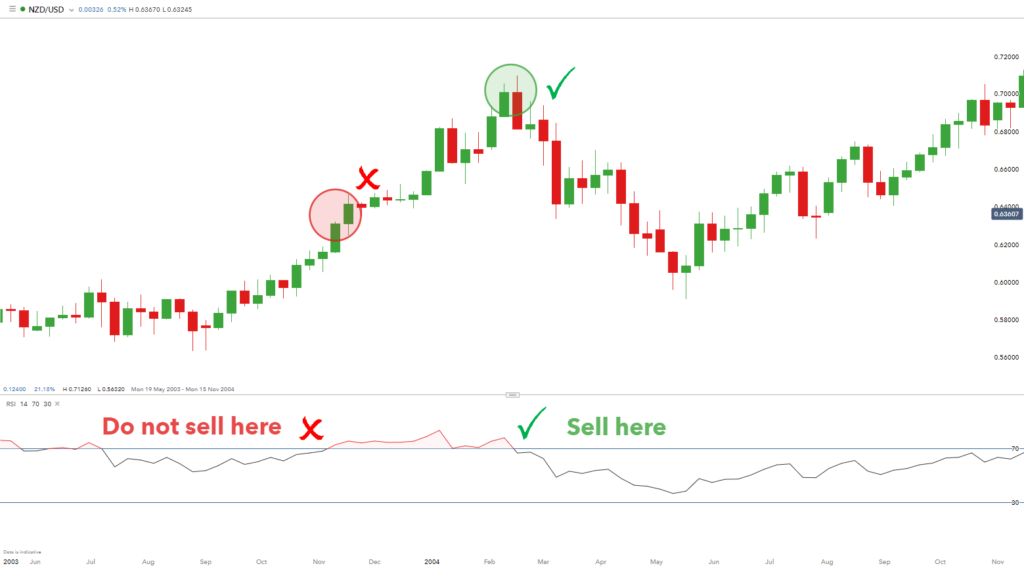
The chart above illustrates the overbought condition that the RSI has reached, yet a seasoned trader would not immediately sell because there is uncertainty as to how far the price could continue to rise. It is optimal to place a short trade once the RSI falls back below 70 and is also evident below 30.