
Traders study price movement in markets to form opinions and base decisions on trends, key price levels, and risk management strategies. The study of price action is frequently used as the first step in price action trading. All other aspects of price action indicators require a trend foundation to begin price action analysis. Trend identification is frequently used as the initial step in price action trading.
Characteristic price action chart:

Price Action as Your First Indicator
Technical analysis setups start with price action as the initial review method. An indicator is a function of price action. The indicator itself is not the ultimate tool for trading, but rather comes behind price action. While the indicator is a crucial part of technical analysis, it is not the only part. Prices can provide information for or about indicators via price action. As such, a trader must first determine what price action is happening (i.e. the trend) before consulting the indicator for an entry signal. After the trend has been identified, the indicator can then be used for an entry signal in the direction of the trend. Traders focus on the change in price rather than indicator value when trading. Some traders base trading decisions and analysis on price action only, while others base them on both price action and technical indicators which function as a support system.
There are different types of technical indicators that are derived from price action, price action dictates what information these indicators provide on a chart. Periodic price data are used to calculate these indicators, which provide substantiation for entry, exit, and stop distance criteria. It is also important to identify trends in market analysis to determine how the market is functioning on a large time frame (time frame dependent).
USD/ZAR price action example:
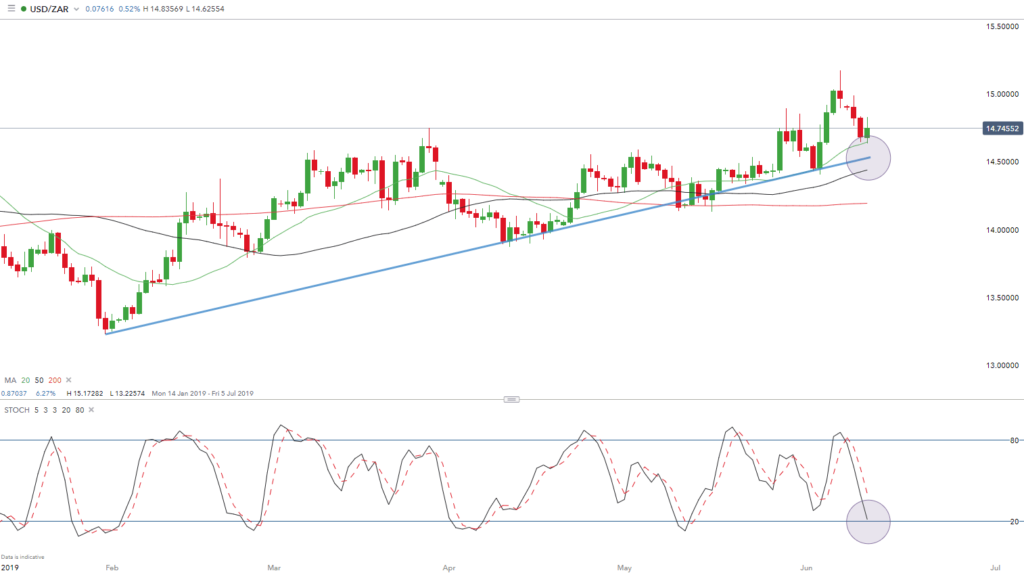
The USD/ZAR chart shown above displays an archetypal trade setup based on a symbiotic relationship between price action and technical indicators. The price action begins at the upward trendline (blue line) and serves as a support level. The forex price is above the 20, 50 and 200 moving average lines, indicating a forex price increase over the last several days.
The stochastic oscillator suggests the market is nearing a lower point, which indicates further bullish movement. As the blue line shows, keeping an eye on the stochastic as well as the price movement is crucial in timing the entry. Once the price reaches this level, trading would be recommend to enter into a long position with appropriate risk management.